

TL;DR
- Australia has allocated 20,350 total nomination places for 2025–26.
- This is a 5,910-place reduction compared to 2024–25.
- VIC, NSW, WA, SA, and TAS face major cuts.
- Queensland is the only state with a massive 190 increase (600 → 1,850).
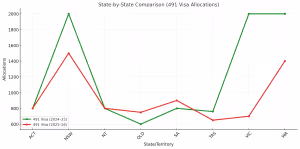
- 491 allocations also tightened significantly, especially in VIC.
- Graphs included below clearly show year-on-year shifts.
- Book a consultation with Knowbal to understand your PR chances.
Prefer watching? Here in this short video explained the key migration updates — watch below 👇
Introduction
State and territory nomination allocations for 2025–26 have now been released. These allocations play a major role in shaping PR pathways for skilled migrants across Australia. They directly influence invitation chances for the 190 and 491 visa programs. As a result, they affect competitiveness, occupation demand, and your chance of receiving an invitation this year.
This year shows significant tightening, meaning applicants must be more strategic with state selection.
Understanding State and Territory Nomination Allocations
State and territory nomination allocations decide how many skilled migrants each state can nominate for the 190 and 491 visas. These numbers also guide which occupations states prioritise. Because allocations change each year, applicants must stay updated. In addition, these numbers help you plan your PR strategy with more clarity and confidence.
These allocations influence:
- Who gets invited
- Which occupations are prioritised
- Points competitiveness
- Onshore vs offshore preferences
Lower allocations = higher competition.
Book a one-on-one consultation with Knowbal today and get expert help with your PR strategy and state selection!
2025–26 State and Territory Nomination Allocations – Full Breakdown
This (Caption: A clear year-on-year comparison showing significant reductions in VIC, NSW, and WA, with moderate increases for QLD and SA.) show a nationwide tightening across most states, with major reductions in VIC, NSW, SA, WA, and TAS. Queensland remains the only major state with a substantial increase in allocations for the 190 visa category.
Below is the official 2025–26 allocation table.
TABLE: 2025–26 Allocations
State/Territory190 (2025–26)491 (2025–26)ACT800800NSW2,1001,500NT850800QLD1,850750SA1,350900TAS1,200650VIC2,700700WA2,0001,400TOTAL12,8507,500
2025–26 TOTAL ALLOCATIONS: 20,350 (190 + 491 combined)
Graph: 190 Visa Allocations (State-by-State, 2024–25 vs 2025–26)
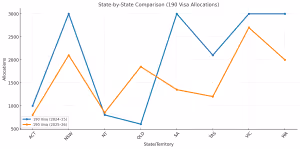
(Caption: This line graph visualises the shift in Subclass 190 allocations across states, highlighting major cuts in VIC, NSW, SA, and WA—and a dramatic increase in QLD.)
Graph: 491 Visa Allocations (State-by-State, 2024–25 vs 2025–26)
State and Territory Nomination Allocations: 2024–25 vs 2025–26 Comparison
Here is the updated comparison table with numeric and percentage changes, now aligned with the graphs above.
The 2025–26 state and territory nomination allocations show major reductions across most states. However, Queensland stands out as the only state with a substantial increase in 190 allocations.
In contrast, Victoria has experienced one of the largest cuts in 491 allocations. Consequently, applicants targeting VIC may need higher points or stronger employment ties.
190 Visa Comparison Table
491 Visa Comparison Table
What the 2025–26 Nomination Allocations Mean for PR Applicants
Reduced allocations this year mean tougher competition. As a result, states may prioritise candidates who demonstrate strong work experience, higher points, or employer support.
In contrast, Queensland’s increased 190 allocation makes it attractive for many occupations. Meanwhile, Victoria’s sharp cut in 491 allocations means some applicants may need to consider regional states or alternative pathways.
State-by-State Insights
Tips to Improve Your Chances in 2025–26
- Lodge your EOI early.
- Strengthen employment documents.
- Improve your English score.
- Review both 190 and 491 pathways.
- Consider QLD, WA, or SA for better chances.
- Align your occupation with state demand.
Knowbal Insight – Our Recommendation
This year requires a clear and well-prepared migration plan. The reduced state and territory nomination allocations mean applicants must choose the right state and visa pathway. With expert guidance, applicants can still achieve strong PR outcomes.
Final Thoughts
The 2025–26 state and territory nomination allocations show a shift in Australia’s skilled migration priorities. Although the numbers are lower, strong candidates with the right strategy can still succeed. Early planning, strong documentation, and correct state selection make a major difference.
Ready to apply? Contact Knowbal Migration today for expert visa support and personalised PR guidance.